
Part 1 – Introduction : What is WaaS?
Part 2 – Windows 10 Updates.
Part 3 – Servicing Channels.
Part 4 – Servicing Tools.
Part 5 – “Getting Current and Staying Current”
Part 6 – “Putting it all together”
Part 7.1 – Introduction to Desktop Analytics
On-boarding Desktop Analytics is outside the scope of this blog series but, since this is aimed at organizations with a fairly large fleet of devices, I’d like to point out a few things. First, unlike Windows Analytics where you could have several instances withing the same Configuration Manager (CM) hierarchy, this is no longer the case. With Desktop Analytics you can have only 1 DA instance per Azure AD tenant. However, just recently in March 2020, Microsoft has extended the DA support to multiple hierarchies. For example, if your organization has 1 Azure AD tenant but say 4 CM hierarchies, you can perform the CM / DA integration onto the one DA dashboard and manage all devices from a single pane of glass in DA.
The DA on-boarding is performed from the Microsoft Endpoint Manager admin center (https://devicemanagement.portal.azure.com) and it must be done by an Azure AD user that is granted with the Azure AD Global Administrator role. This is because an App, MALogAnalyticsReader, is created and it needs to be authorized to sign in and granted the read user profile permission. In addition, the Desktop Analytics wizard will ask you to either specify a pre-created Workspace (and therefore the on-boarding user must have the required access rights to it) or you will be prompted to create a new workspace (again, the on-boarding user must have the required rights to do so).
Once you’ve completed the implementation wizard, you will be provided with a commercial ID which is used during the DA integration from Configuration Manager and when you enable DA on your devices as well (both discussed later in this blog).
For detailed steps on how to onboard Desktop Analytics, check How to setup Desktop Analytics in Microsoft Docs. Then you must Connect Configuration Manager with Desktop Analytics and then you’ll have to Enroll devices in Desktop Analytics.
In the end, your DA <> CM <> Devices setup can be represented in a triangular network communication like so:

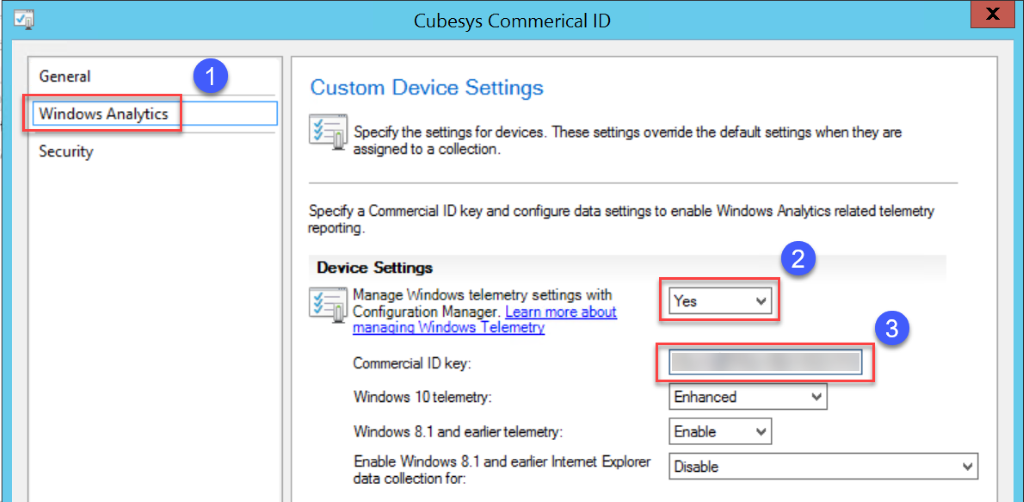
Between MEM Configuration Manager and the Managed Windows Devices, you simply have to configure a Device Settings package to include the MEM Desktop Analytics Commercial ID:
The network communications between your (Primary Site) MEM Configuration Manager and MEM Desktop Analytics need to be whitelisted for the following endpoints:
| Endpoint | Function |
| https://aka.ms | Used to locate the service |
| https://graph.windows.net | Used to automatically retrieve settings like CommercialId when attaching your hierarchy to Desktop Analytics (on Configuration Manager Server role). |
| https://*.manage.microsoft.com | Used to synch device collection memberships, deployment plans, and device readiness status with Desktop Analytics (on Configuration Manager Server role only). |
Finally, the Windows OS Configuration Manager managed devices need to be whitelisted for the following endpoints:
- User experience and diagnostic component endpoints
| Endpoint | Function |
| https://v10c.events.data.microsoft.com | Connected user experience and diagnostic component endpoint. Used by devices running Windows 10, version 1809 or later, or version 1803 with the 2018-09 cumulative update or later installed. |
| https://v10.events.data.microsoft.com | Connected user experience and diagnostic component endpoint. Used by devices running Windows 10, version 1803 without the 2018-09 cumulative update installed. |
| https://v10.vortex-win.data.microsoft.com | Connected user experience and diagnostic component endpoint. Used by devices running Windows 10, version 1709 or earlier. |
| https://vortex-win.data.microsoft.com | Connected user experience and diagnostic component endpoint. Used by devices running Windows 7 and Windows 8.1 |
- Client devices need to communicate with the following endpoints:
| Endpoint | Function |
| https://settings-win.data.microsoft.com | Enables the compatibility update to send data to Microsoft. |
| http://adl.windows.com | Allows the compatibility update to receive the latest compatibility data from Microsoft. |
| https://watson.telemetry.microsoft.com | Windows Error Reporting (WER). Required to monitor deployment health in Windows 10, version 1803 or earlier. |
| https://umwatsonc.events.data.microsoft.com | Windows Error Reporting (WER). Required for device health reports in Windows 10, version 1809 or later. |
| https://ceuswatcab01.blob.core.windows.net | Windows Error Reporting (WER). Required to monitor deployment health in Windows 10, version 1809 or later. |
| https://ceuswatcab02.blob.core.windows.net | Windows Error Reporting (WER). Required to monitor deployment health in Windows 10, version 1809 or later. |
| https://eaus2watcab01.blob.core.windows.net | Windows Error Reporting (WER). Required to monitor deployment health in Windows 10, version 1809 or later. |
| https://eaus2watcab02.blob.core.windows.net | Windows Error Reporting (WER). Required to monitor deployment health in Windows 10, version 1809 or later. |
| https://weus2watcab01.blob.core.windows.net | Windows Error Reporting (WER). Required to monitor deployment health in Windows 10, version 1809 or later. |
| https://weus2watcab02.blob.core.windows.net | Windows Error Reporting (WER). Required to monitor deployment health in Windows 10, version 1809 or later. |
| https://kmwatsonc.events.data.microsoft.com | Online Crash Analysis (OCA). Required for device health reports in Windows 10, version 1809 or later. |
| https://oca.telemetry.microsoft.com | Online Crash Analysis (OCA). Required to monitor deployment health in Windows 10, version 1803 or earlier. |
| https://login.live.com | Required to provide a more reliable device identity for Desktop Analytics. To disable end-user Microsoft account access, use policy settings instead of blocking this endpoint. For more information, see The Microsoft account in the enterprise. |
| https://v20.events.data.microsoft.com | Connected user experience and diagnostic component endpoint. |
Source:https://docs.microsoft.com/en-us/configmgr/desktop-analytics/enable-data-sharing
The on-boarding is rather straightforward: A wizard here, an integration there, proxy-whitelisting devices and your done. Well, not quite…
When you add Desktop Analytics as an Azure Cloud service app in Configuration Manager, it is important to note a few things:
- You must select the ‘Target Collection’. This is the top collection of all the collections you will use with Desktop Analytics. It doesn’t necessarily have to be the built-in All Systems collections. But it must be the parent of any of the collection you will add in the ‘Additional Collections’. For example, if you have a collection for devices in all of Asia, one for countries in the Pacific region, one for North America and another for South America, the Target Collection must be the Limiting Collection for each of them (whether it is a ‘parent’ or ‘grand-parent’ collection, the child collections must be direct descendants). If the North and South America collections have a Limiting Collection called America but the Asia and Pacific Collections have a Limiting Collection called APAC, you don’t have a parent collection that is high enough in the hierarchy to covers all 4 regions. You might end up having to create a collection called America & APAC and use it as the Limiting Collection for the America and for the APAC collections.
- Additional Collections: This is so that you may add device collections that will be included in the Pilot and those that will be excluded from it in addition to the device collections that will be upgraded in Production.
Here’s how it works. Using the example above, suppose that you want to create 1 deployment project for all your devices in North and in South America. First, you must add the device collections that contain all your managed devices in these 2 continents. Then, as you know, you will first have a Pilot deployment and more often than not you already know which devices you want to include in your Pilot such as from the IT department, your dev, finance, marketing, manufacturing, etc. Therefore, you should create a collection(s) with these devices (from North and South America) and add the collection(s) to the ‘Additional Collections’. And finally, out of all the devices in America, there will be some devices that you want to exclude such as devices from your C-level management or business critical devices. Hence, you need to have a collection with these devices as well and also add it to the ‘Additional Collections’.

Note: Microsoft recommends not adding more than 20 collections although this is not a hard limit.
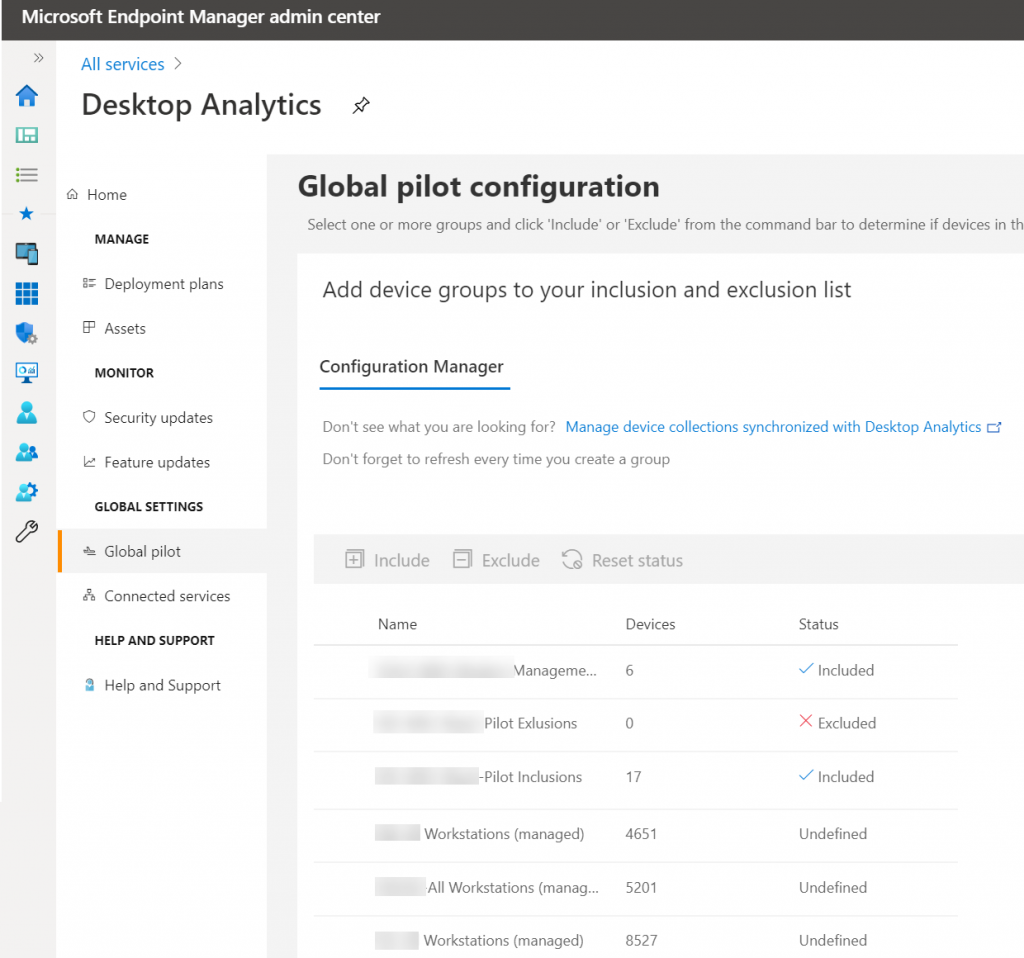
Back in Desktop Analytics on the MEM Portal, the Global Pilot will show the list of collections you’ve selected including the Target and the Additional Collections. You need to select the pilot inclusion and pilot exclusion collections and tick them to be included or excluded from pilot (but not the other collections such as the one for North America and South America).
When you are creating a Deployment Plan for America, your target groups are your North and South America collections. You don’t need to add the Pilot inclusion and exclusion collections because those devices are already members of the broader collections. Desktop Analytics will recognize them as members of the deployment plan and, when it is time to identify your Pilot devices, it will include those from the inclusion collection and exclude those from the exclusion collection. Furthermore, Desktop Analytics will use Artificial Intelligence to recommend specific devices from the broader collections (North and South America) to increase the coverage of your Apps and Drivers pilot testing.

Next week’s blog goes in a little more detail on Deployment Plans and the Desktop Analytics phases with their steps. Stay tuned!